Air explained
A high AQI tells us the air is bad. Does it tell us why?
How India’s AQI works, what its six categories mean, and why a pollution reading cannot tell us who caused it.

Educational reading, reviewed 17 Oct 2026. Requirements depend on the applicable methodology and project; this article does not describe CarbonPod’s achieved results or a service offer.
An AQI number is easy to share. Explaining what caused it takes more work.
Imagine seeing a reading of 320 on your phone. Under India’s National Air Quality Index, that falls in the “Very Poor” category. It is a signal to take air quality seriously. But the number cannot tell you how much came from a road, a factory, a field or somewhere outside the city.
That distinction matters whenever a screenshot becomes an argument about who is responsible.
First, what does the number measure?
India’s AQI turns pollutant measurements into a common index. At a monitoring location, each eligible pollutant gets a sub-index. The highest determines the overall AQI, subject to data-availability requirements. It is not the average of those sub-indices. CPCB’s AQI explainer
Here is a simplified example. Suppose the valid sub-indices are 320 for PM2.5, 180 for PM10 and 70 for nitrogen dioxide. The overall AQI would be 320.
These are invented values to show the calculation, not readings from Delhi or any other location. They are index values, not pollutant concentrations.
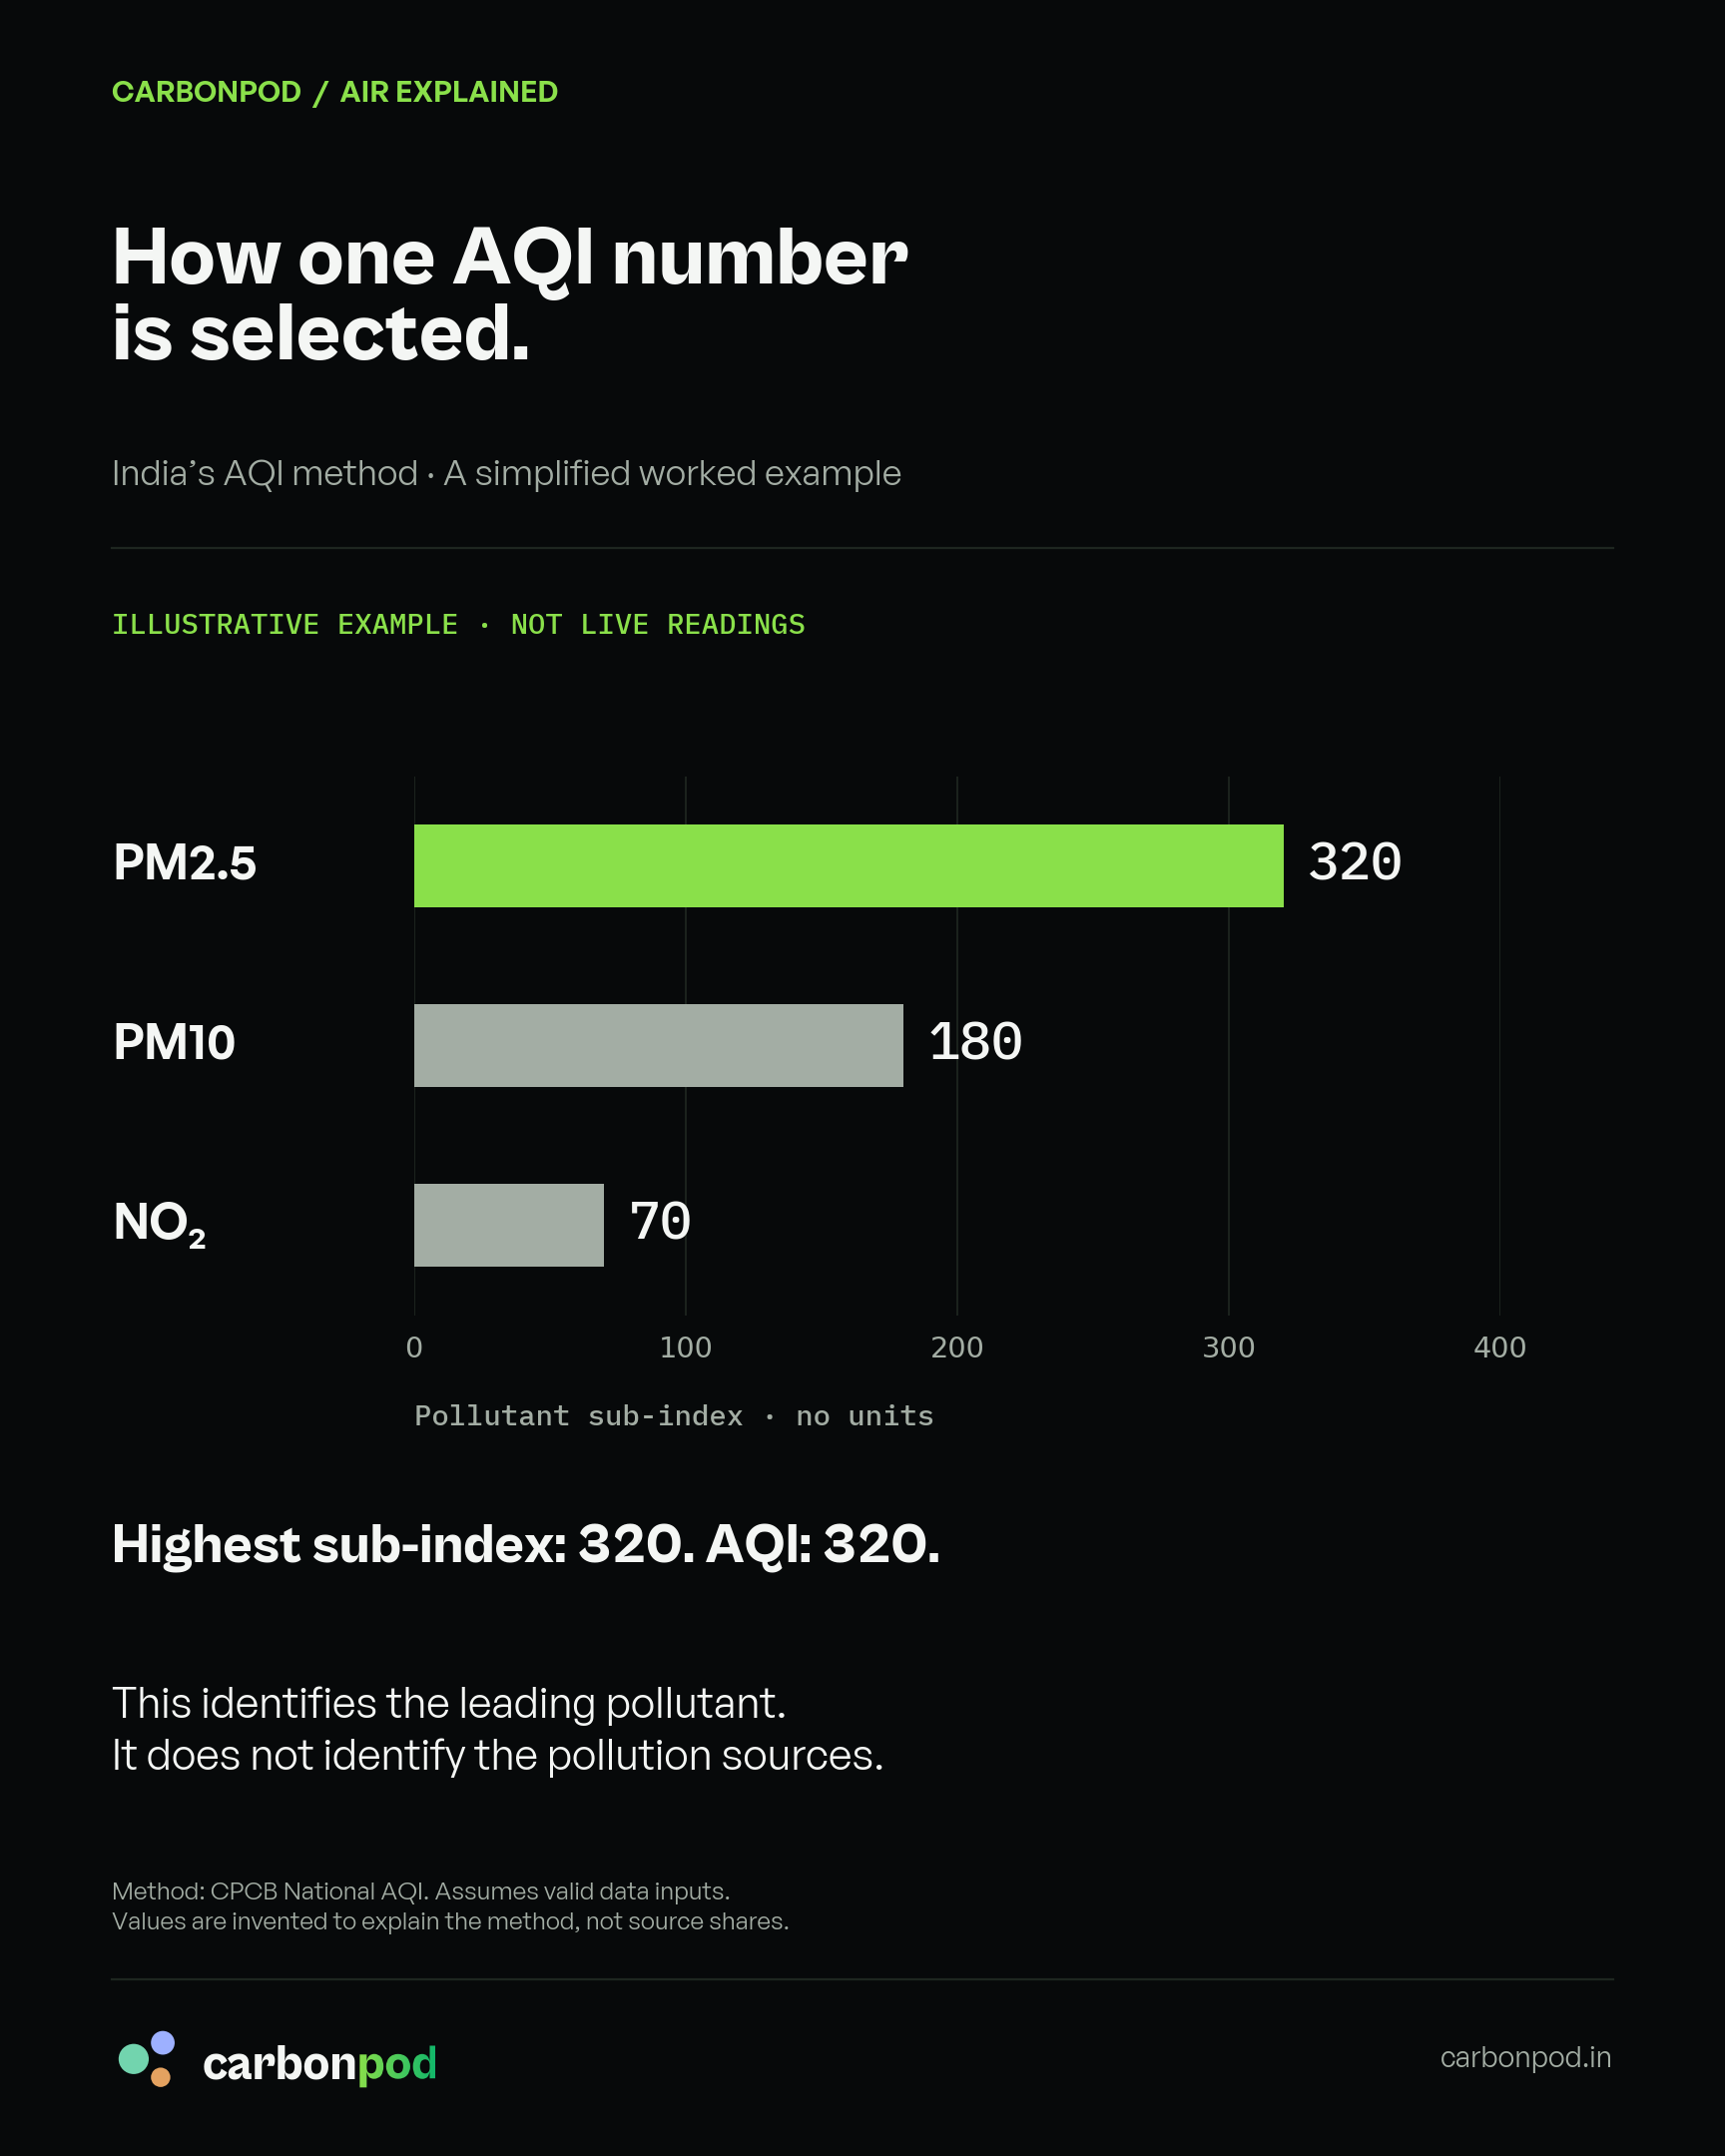
The bars explain how the index is selected. They do not represent source contributions or quantities of pollution.
A pollutant is not a source
PM2.5 describes a particle size, not where the particles came from.
CAQM’s February 2026 review of source studies identified several contributors to Delhi’s PM2.5, including transport, biomass burning, dust and industry. It also described secondary particles formed from gases released by multiple sectors. CAQM / PIB review
So learning that PM2.5 is driving an AQI reading still leaves another question: which activities contributed to those particles, and by how much?
That calls for source-apportionment evidence. A seasonal research estimate can help explain the broader picture. It should not be pasted onto today’s AQI as though it were a breakdown of today’s air.
Our Delhi pollution explainer looks at that wider mix and how it changes between seasons.
Read the label around the number
Before comparing two screenshots, check the location, time, averaging period and index system. A station reading and a city summary are not interchangeable. Neither are readings from different hours or countries using different AQI methods.
The Indian framework covers eight pollutants, although not all are monitored everywhere. Its calculation generally uses 24-hour pollutant averages, with eight-hour averages for carbon monoxide and ozone. Indian Economic Service explanation
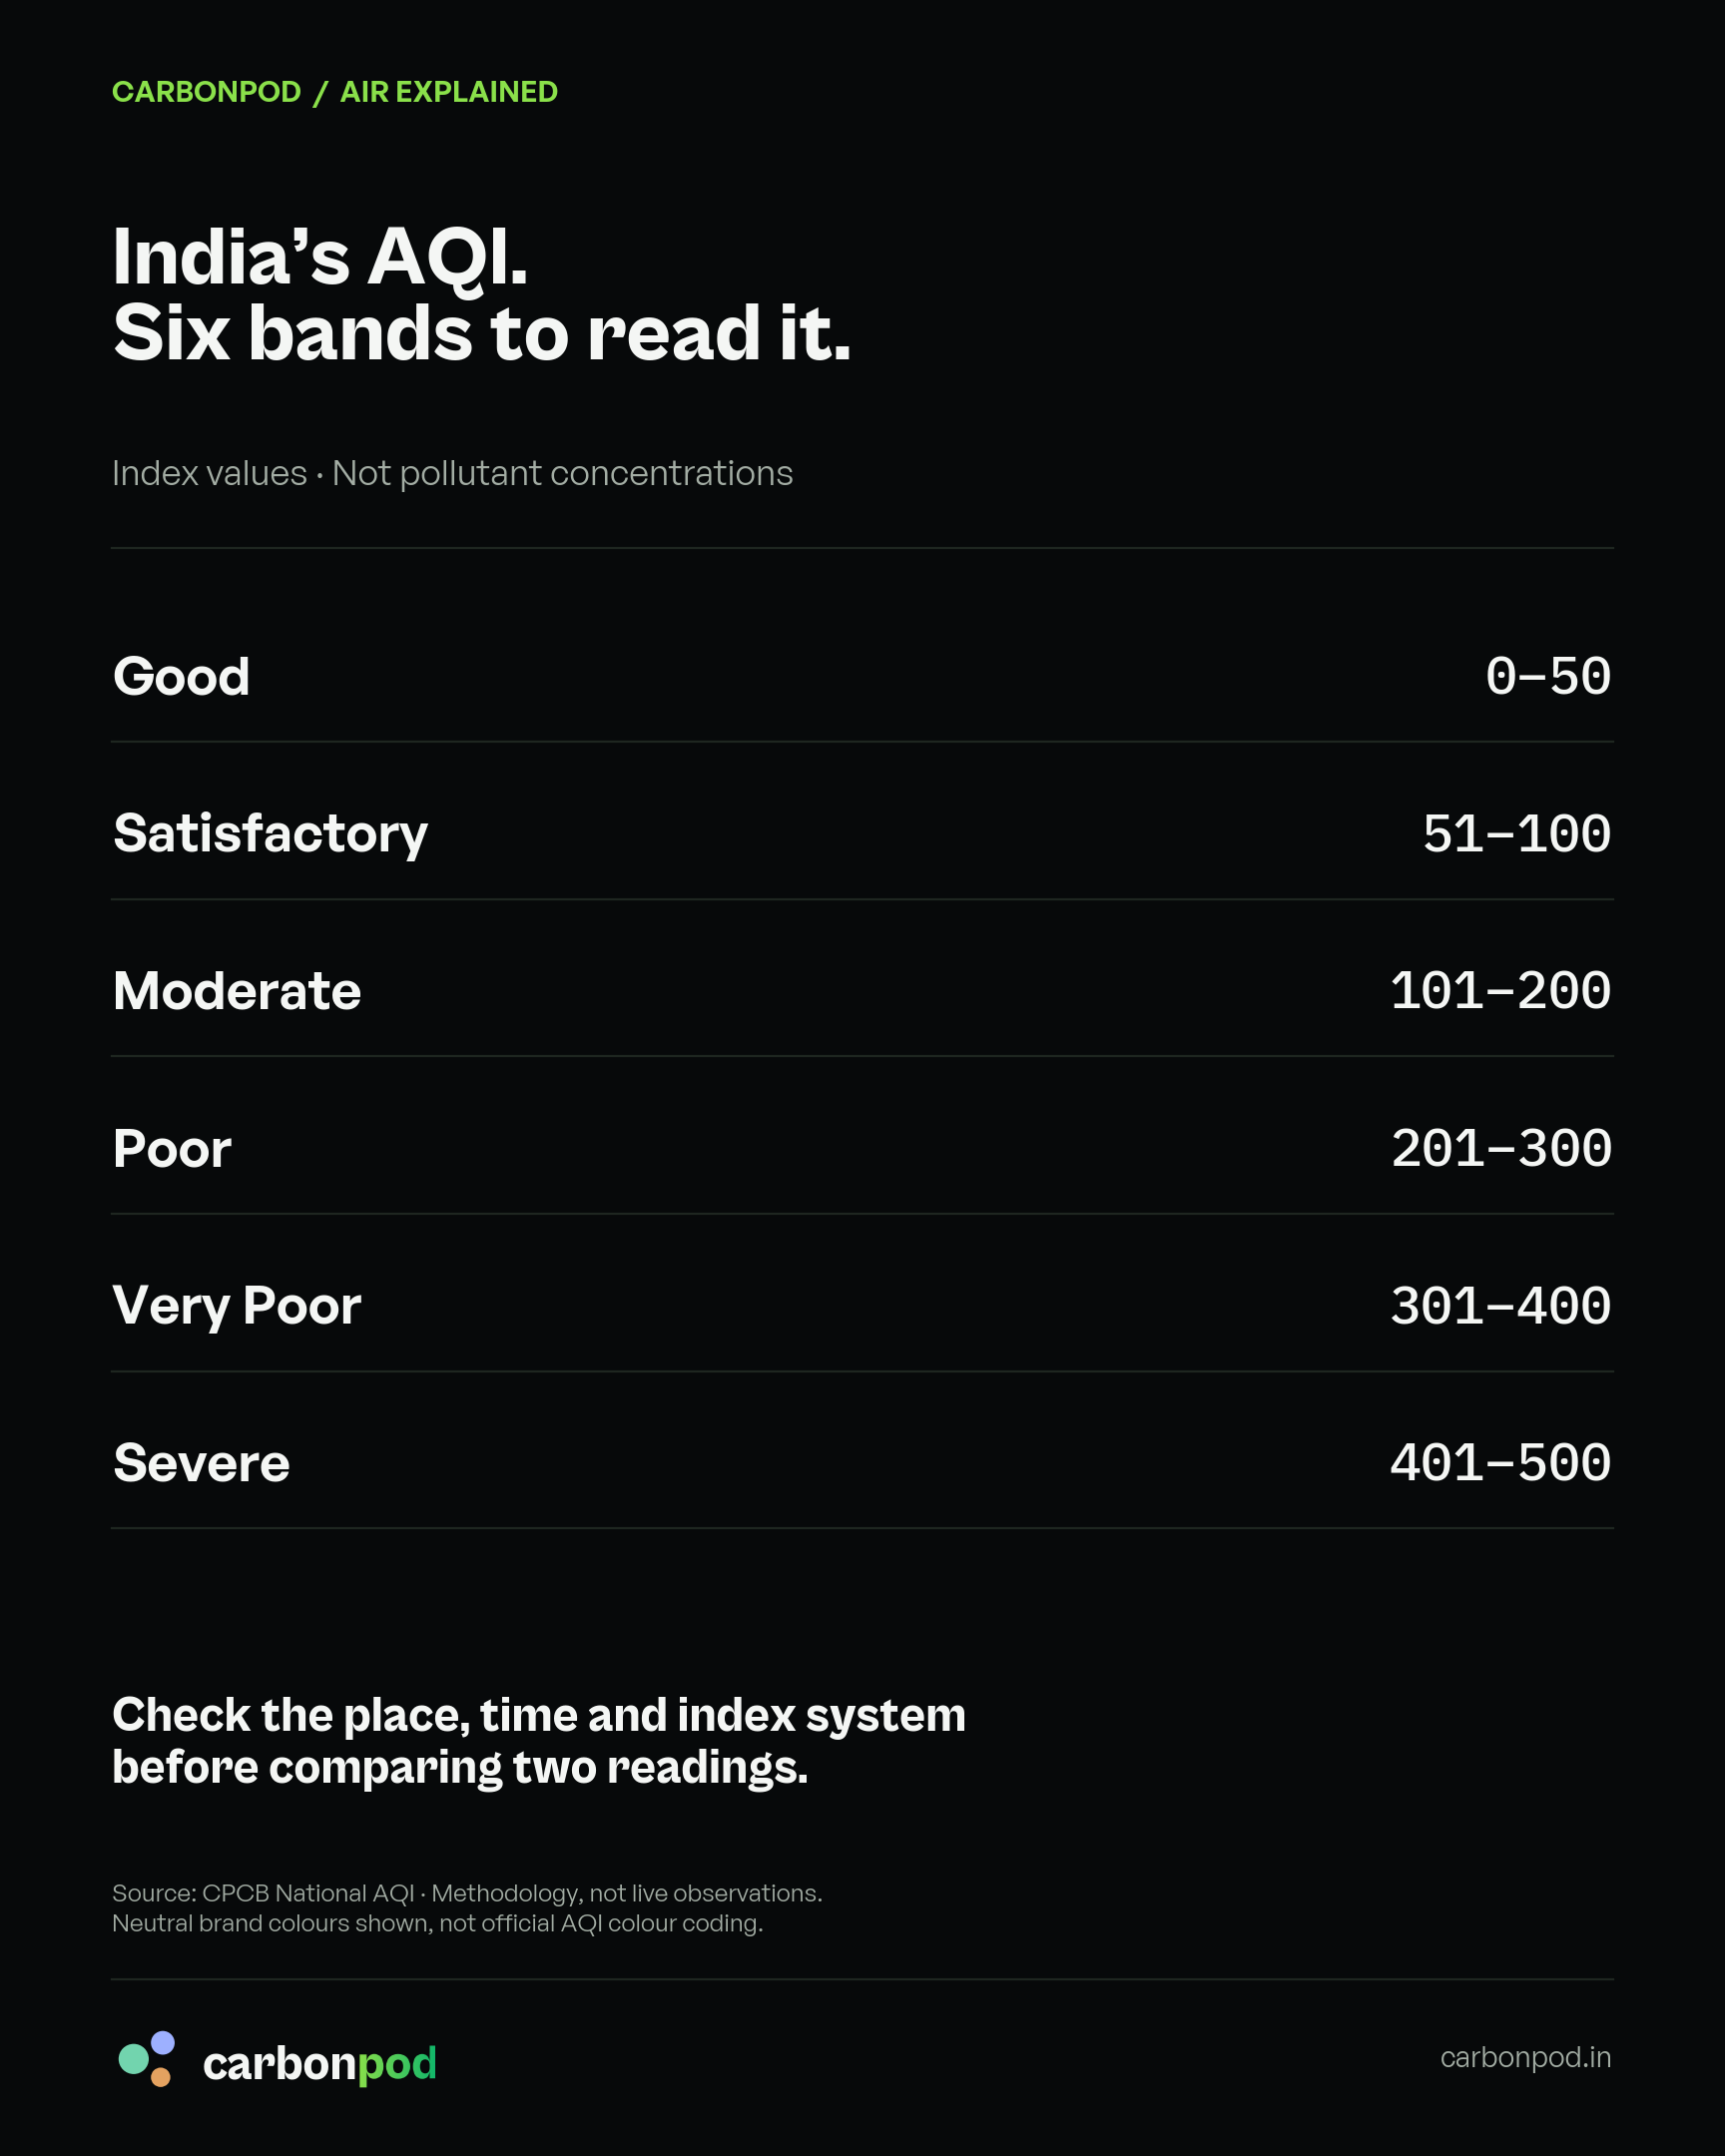
These are index bands, not concentrations or source shares. The neutral design is not the official AQI colour scale.
What this means for the residue conversation
A worrying AQI reading deserves attention. It does not, by itself, tell us what share came from crop-residue burning.
For CarbonPod, the practical conversation is about making alternatives workable: what residue is suitable, when it can be collected, and where it can reliably go. Those questions need evidence of their own. A rising or falling city AQI would not, on its own, prove the impact of a particular project.
Use AQI to understand the air-quality signal. Use source evidence to understand the causes. We need both to have a useful conversation.