Air explained
Do fewer fire dots mean cleaner air in Delhi?
A satellite detection and an air monitor answer different questions. Practical examples explain the missing steps between fire counts and Delhi’s air.
Educational reading, reviewed 1 Nov 2026. Requirements depend on the applicable methodology and project; this article does not describe CarbonPod’s achieved results or a service offer.
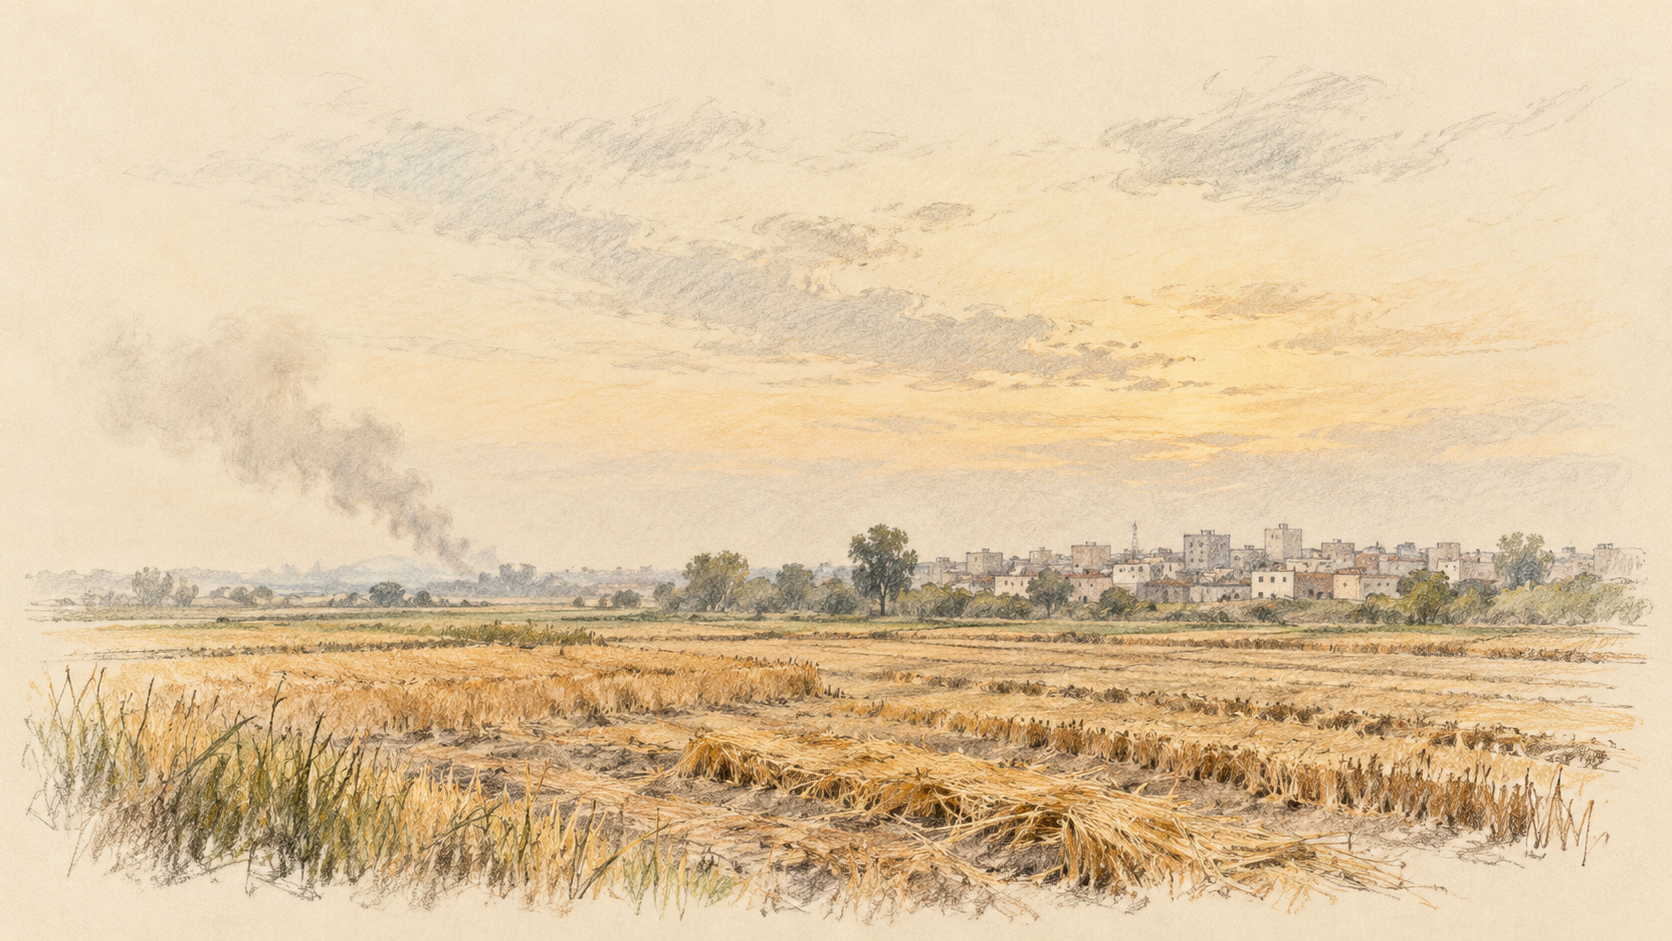
A fire map looks quieter. Does that mean Delhi's air must be cleaner? And if the air improves, does that tell us how much burning fell?
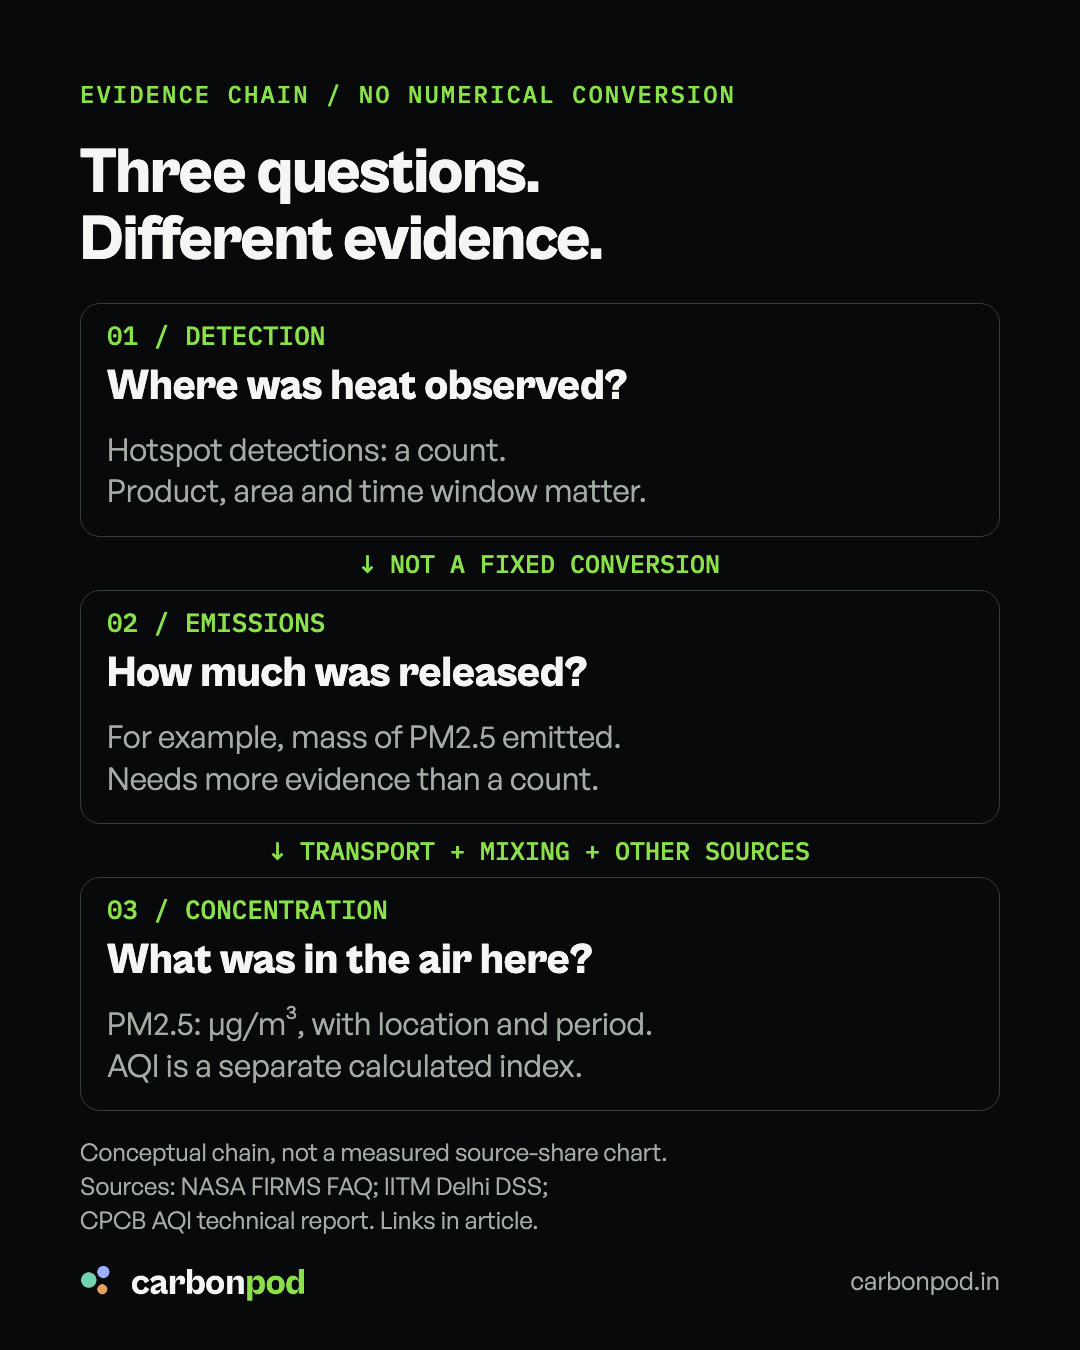
But a satellite fire count and an air-quality reading describe different parts of the story. Neither can stand in for the other.
For a recent example, IITM's 31 October 2026 bulletin reported Delhi's CPCB AQI at 60, in the Satisfactory category, at 4 p.m. on 30 October. That describes air quality at that reporting time. It does not, by itself, tell us what happened to crop burning or its contribution. IITM bulletin
Here is how to read the gap without dismissing either measurement.
A fire dot is a detection, not a farmer or a field
NASA's FIRMS satellites observe heat. A hotspot marks a pixel flagged for fire or another thermal anomaly. One pixel may contain more than one fire; a detection is not automatically one unique burning field.
Timing matters too. A short burn can begin and end between observations. Cloud or heavy smoke can hide a fire. A small or cool fire may go undetected. So a blank patch of map is not proof that nothing burned there. NASA FIRMS FAQ
Example: a field burns after one satellite pass and goes out before the next. The event can release smoke without appearing in that satellite's detections. This is an illustration of a sampling limit, not a claim about a particular farm.
Counting detections does not weigh the smoke
Two detected fires need not burn the same quantity of material or emit the same mass of particles.
Fuel amount, the area actually burning and combustion conditions affect emissions. NASA explicitly cautions against treating active-fire pixels as burned area. A count alone therefore cannot tell us tonnes of residue burned or kilograms of PM2.5 emitted. NASA FIRMS guidance
A smaller count is worth investigating. To interpret it, first keep the satellite product, geography, observation window and counting method consistent.
Smoke has to travel, and Delhi has other sources
An upwind fire and a Delhi monitor are separated by a moving atmosphere.
Wind direction determines the transport pathway. Mixing affects dilution. Pollution reaching Delhi can therefore differ even when the number of detections elsewhere looks similar. Traffic, industry, dust and other local or regional emissions also contribute.
IITM's Delhi Decision Support System estimates contributions through a numerical model, with separate categories for stubble burning, transport, road dust, industry and surrounding districts. That extra modelling is needed because the fire map does not measure those source contributions at a Delhi monitor. IITM DSS
Example: fewer detected fires do not guarantee cleaner air if dispersion worsens or other emissions rise. Conversely, cleaner air on a windy day does not establish that burning stopped. These are possible scenarios, not a diagnosis of this week's changes.
Check the label before comparing two numbers
PM2.5 concentration is measured in micrograms per cubic metre. AQI is an index calculated from pollutant concentrations, with pollutant-specific averaging periods. For India's PM2.5 sub-index, CPCB specifies a 24-hour averaging period. An hourly PM2.5 value and a reported AQI are not interchangeable. CPCB AQI technical report
Before sharing a “fires down, pollution up” comparison, ask:
- Same fire measure? Which satellite, area, dates and counting method?
- Same air measure? Which station or city measure, pollutant, units and averaging period?
- Evidence for the connection? What do transport, weather and source-contribution analysis show?
Also separate observation from forecast. IITM's DSS currently states that its next-three-day stubble-contribution forecast uses climatological fire-count and emissions data. A forecast percentage is not a direct measurement of today's fires.
Fire detections help track burning. Air monitors help track the air. Explaining the link requires evidence between them.